Teleport Blog - Go and structured logging with ElasticSearch - Jan 1, 2016
Go and structured logging with ElasticSearch
In this blog post we are going to talk about the quick experiment we did with Go and Elastic beats. We will integrate Go logger to emit logs in structured format to Elastic Search for your viewing pleasure.
What is beats?
Beats is a new awesome Go library to build and ship documents to ElasticSearch. We've decided to give it a try and integrate Go structured logger logrus to ship logs to ELK using new API.
Structured logs
First, lets write start emitting structured logs.
We will use combination of logrus to emit logs and trace that provides a hook to capture debugging info such as file, line and function and emit UDP events (will get to the UDP part later).
package main

import (
	"os"
	"os/signal"
	"time"
	log "github.com/Sirupsen/logrus"
	"github.com/gravitational/trace"
)

func main() {
	// Log as JSON instead of the default ASCII formatter.
	log.SetFormatter(&trace.TextFormatter{})

	h, err := trace.NewUDPHook()
	if err != nil {
		log.Fatalf("hook: %v", err)
	}
	log.AddHook(h)

	log.Infof("something new")
	log.WithFields(log.Fields{trace.Component: "play"}).Infof("this time")
}
Or if you are lazy, just grab it from github:
$ go install github.com/gravitational/udpbeat/examplebeater
$ examplebeater
This little program will periodically emit logs with file, line, function and other parts to UDP address.
Udpbeat
Udpbeat is a Beats based agent that collects UDP messages and ships them to ELK
Here's how it all works together:

Agent can run on any machine and your processes will be shipping logs to this tiny agent without bringing beat's deps or depending on Elasticsearch API
$ go install github.com/gravitational/udpbeat
$ udpbeat -c ${GOPATH}/src/github.com/gravitational/udpbeat/trace.yml
Note, that you can (and probably should) modify the configs to setup logging/output.
ELK part
Ok, the last part is starting Elasticsearch and Kibana and setting document schema. That's easy with Docker.
Start ElasticSearch and Kibana:
$ docker run -p 9200:9200 -p 9300:9300 --name elk -d elasticsearch
$ docker run -p 5601:5601 --link elk:elasticsearch -d kibana
Set trace document schema to tell ELK how to index incoming documents emitted by udpbeat
$ curl -XPUT 'http://localhost:9200/_template/trace' \
       -d@${GOPATH}/src/github.com/gravitational/udpbeat/template.json
This template.json explaining ElasticSearch how to interpret the incoming document's fields
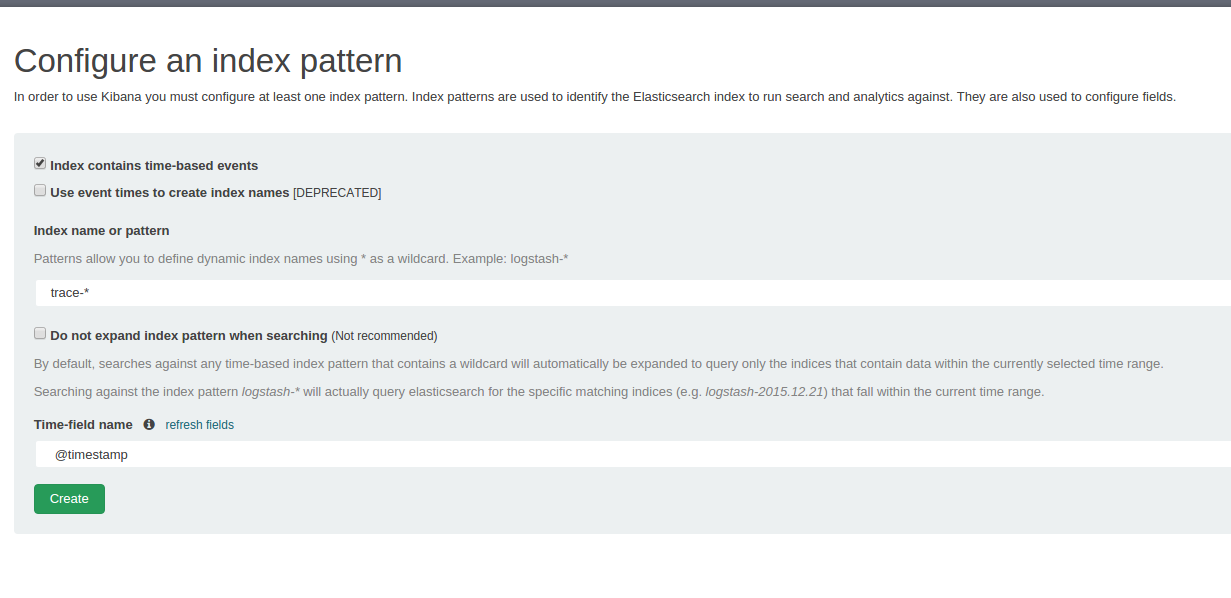
- Open Kibana and configure mappings:
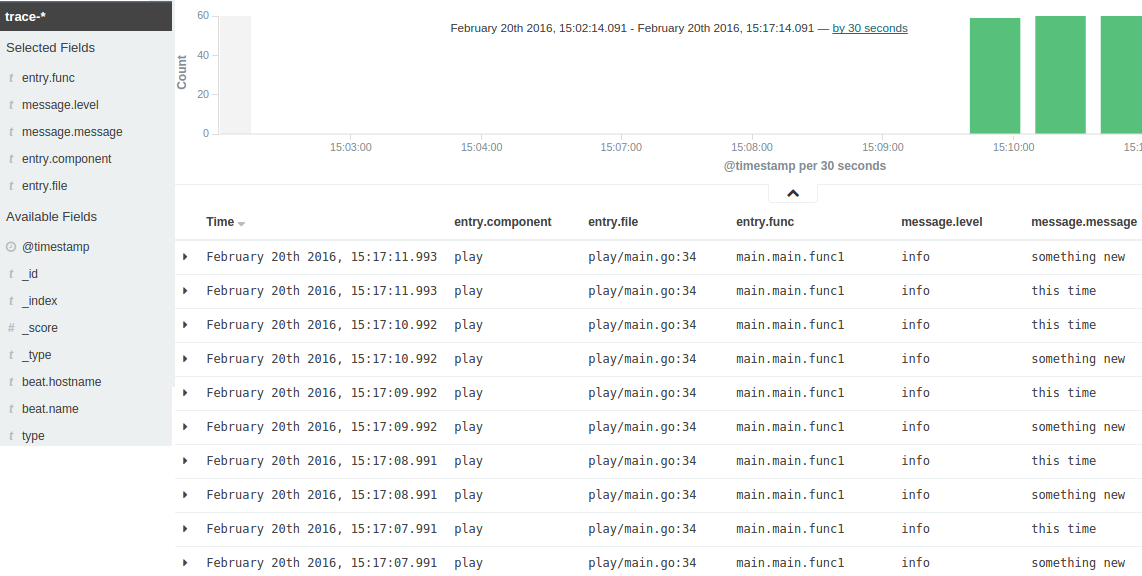
- Discover the logs emitted by our little test logging library:
Teleport cybersecurity blog posts and tech news
Every other week we'll send a newsletter with the latest cybersecurity news and Teleport updates.
Summary
Beats is a major step forward to writing customized data shippers, paired with Go's runtime knowledge of lines, files we get very nice framework for production logging.
Notice Udpbeat is quite nice and simple, but we haven't tested it in production yet,however we are about to that very soon!
Tags
Teleport Newsletter
Stay up-to-date with the newest Teleport releases by subscribing to our monthly updates.


Subscribe to our newsletter